Ben Yoskovitz is the co-author of Lean Analytics, a new book on how to use analytics successfully in your business. Ben is currently VP Product at GoInstant, which was acquired by Salesforce in 2012. He blogs regularly at Instigator Blog and can be followed @byosko.
We all know metrics are important. They help report progress and guide our decision making. Used properly, metrics can provide key insights into our businesses that make the difference between success and failure. But as our capacity to track everything increases, and the tools to do so become easier and more prevalent, the question remains: what is a worthwhile metric to track?
Before you can really figure that out it's important to understand the basics of metrics. There are in fact good numbers and bad numbers. There are numbers that don't help and numbers that might save the day.
First, here's how we define analytics: Analytics is the measurement of movement towards your business goals.
The two key concepts are "movement" and "business goals". Analytics isn't about reporting for the sake of reporting, it's about tracking progress. And not just aimless progress, but progress towards something you're trying to accomplish. If you don't know where you're going, metrics aren't going to be particularly helpful.
With that definition in mind, here's how we define a "good metric".
A good metric is:
-
Comparative
-
Understandable
-
A ratio or rate
-
Behavior changing
A good metric is comparative. Being able to compare a metric across time periods, groups of users, or competitors helps you understand which way things are moving. For example, "Increased conversion by 10% from last week" is more meaningful than "We're at 2% conversion." Using comparative metrics speaks clearly to our definition of "movement towards business goals".
A good metric is understandable. Take the numbers you're tracking now--the ones you think are the most important--and show those to outsiders. If they don't instantly understand your business and what you're trying to do, then the numbers you're tracking are probably too complex. And internally, if people can't remember the numbers you're focused on and discuss them effectively, it becomes much harder to turn a change in the data into a change in the culture. Try fitting your key metrics on a single TV screen (and don’t cheat with a super small font either!)
A good metric is a ratio or a rate. Ratios and rates are inherently comparative. For example, if you compare a daily metric to the same metric over a month, you'll see whether you're looking at a sudden spike or a long-term trend. Ratios and rates (unlike absolute numbers) give you a more realistic "health check" for your business and as a result they're easier to act on. This speaks to our definition above about "business goals"--ratios and rates help you understand if you're heading towards those goals or away from them.
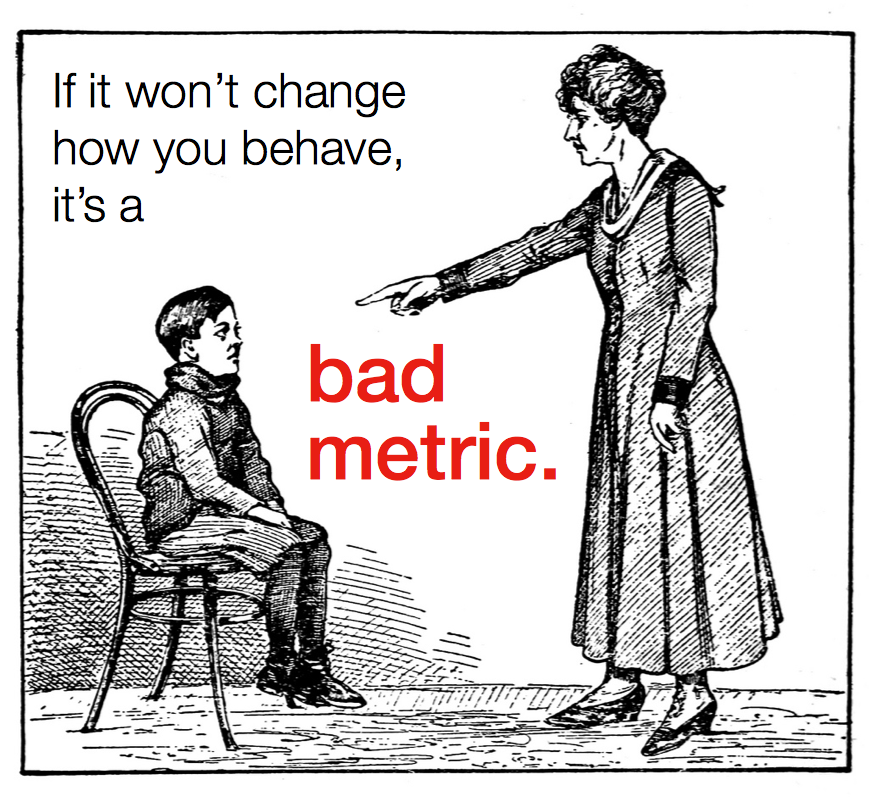
A good metric changes the way you behave. This is by far the most important criterion for a metric: what will you do differently based on changes in the number? If you don't know, it's a bad metric. This doesn't mean you don't track it--we generally suggest that you track everything but only focus on one thing at a time because you never know when a metric you're tracking becomes useful. But when looking at the key numbers you're focused on today, ask yourself if you really know what you'd do if those numbers go up, down or stay the same. If you don't, put those metrics aside and look for better ones to track right now.
http://www.flickr.com/photos/circasassy/7858155676/
Now that we've defined a "good" metric let's look at five things you should keep in mind when choosing the right metrics to track:
-
Qualitative versus quantitative metrics
-
Vanity versus actionable metrics
-
Exploratory versus reporting metrics
-
Leading versus lagging metrics
-
Correlated versus causal metrics
1. Qualitative versus Quantitative metrics
Quantitative data is easy to understand. It's the numbers we track and measure--for example, sports scores and movie ratings. As soon as something is ranked, counted, or put on a scale, it's quantified. Quantitative data is nice and scientific, and (assuming you do the math right) you can aggregate it, extrapolate it, and put it into a spreadsheet. Quantitative data doesn't lie, although it can certainly be misinterpreted. It's also not enough for starting a business. To start something, to genuinely find a problem worth solving, you need qualitative input.
Qualitative data is messy, subjective, and imprecise. It's the stuff of interviews and debates. It's hard to quantify. You can't measure qualitative data easily. If quantitative data answers "what" and "how much," qualitative data answers "why." Quantitative data abhors emotion; qualitative data marinates in it.
When you first get started with an idea, assuming you're following the core principles around Lean Startup, you'll be looking for qualitative data through problem interviews. You're speaking to people--specifically, to people you think are potential customers in the right target market. You're exploring. You're getting out of the building.
Collecting good qualitative data takes preparation. You need to ask specific questions without leading potential customers or skewing their answers. You have to avoid letting your enthusiasm and reality distortion rub off on your interview subjects. Unprepared interviews yield misleading or meaningless results. We cover how to interview people in Lean Analytics, but there have been many others that have done so as well. Ash Maurya’s book Running Lean provides a great, prescriptive approach to interviewing. I also recommend Laura Klein’s writing on the subject.
Sidebar: In writing Lean Analytics, we proposed the idea of scoring problem interviews. The basic concept is to take the qualitative data you collect during interviews and codify it enough to give you (hopefully!) new insight into the results. The goal of scoring problem interviews is to reduce your own bias and ensure a healthy dose of intellectual honesty in your efforts. Not everyone agrees with the approach, but I hope you'll take a look and try it out for yourself.
2. Vanity versus Actionable metrics
I won't spent a lot of time on vanity metrics, because I think most people reading OnStartups understand these. As mentioned above, if you have a piece of data that can't be acted upon (you don't know how movement in the metric will change your behavior) then it's a vanity metric and you should ignore it.
It is important to note that actionable metrics don't automatically hold the answers. They're not magic. They give you an indication that something fundamental and important is going on, and identify areas where you should focus, but they don't provide the answers. For example, if "percent of active users" drops, what do you do? Well, it's a good indication that something is wrong, but you'll have to dig further into your business to figure it out. Actionable metrics are often the starting point for this type of exploration and problem solving.
3. Exploratory versus Reporting metrics
Reporting metrics are straightforward--they report on what's going on in your startup. We think of these as "accounting metrics", for example, "How many widgets did we sell today?" Or, "Did the green or the red widget sell more?" Reporting metrics can be the results of experiments (and therefore actionable), but they don't necessarily lead to those "eureka!" moments that can change your business forever.
Exploratory metrics are those you go looking for. You're sifting through data looking for threads of information that are worth pursuing. You're exploring in order to generate ideas to experiment on. This fits what Steve Blank says a startup should spend its time doing: searching for a scalable, repeatable business model.
A great example of using exploratory metrics is from Mike Greenfield, co-founder of Circle of Moms. Originally, Circle of Moms was Circle of Friends (think: Google Circles inside Facebook). Circle of Friends grew very quickly in 2007-2008 to 10 million users, thanks in part to Facebook's open platform. But there was a problem--user engagement was terrible. Circle of Friends had great virality and tons of users, but not enough people were really using the product.
So Mike went digging.
And what Mike found was incredible. It turns out that moms, by every imaginable metric, were insanely engaged compared to everyone else. Their messages were longer, they invited more people, they attached more photos, and so on. So Mike and his team pivoted from Circle of Friends to Circle of Moms. They essentially abandoned millions of users to focus on a group of users that were actually engaged and getting value from their product. From the outside looking in this might have been surprising or confusing. You might find yourself at a decision point like Mike and worry about what investors will think, or other external influencers. But if you find a key insight in your data that’s incredibly compelling, you owe it to yourself to act on it, even if it looks crazy from the outside. For Mike and Circle of Moms, it was the right decision. The company grew their user base back up to 4 million users and eventually sold to Sugar Inc.
4. Leading versus Lagging metrics
Leading and lagging metrics are both useful, but they serve different purposes. Most startups start by measuring lagging metrics (or "lagging indicators") because they don't have enough data to do anything else. And that's OK. But it's important to recognize that a lagging metric is reporting the past; by the time you know what the number is, whatever you’re tracking has already happened. A great example of this is churn. Churn tells you what percentage of customers (or users) abandon your service over time. But once a customer has churned out they're not likely to come back. Measuring churn is important, and if it's too high, you'll absolutely want to address the issue and try to fix your leaky bucket, but it lags behind reality.
A leading metric on the other hand tries to predict the future. It gives you an indication of what is likely to happen, and as a result you can address a leading metric more quickly to try and change outcomes going forward. For example, customer complaints is often a leading indicator of churn. If customer complaints are going up, you can expect that customers will abandon and churn will also go up. But instead of responding to something that's already happened, you can dive into customer complaints immediately, figure out what's going on, resolve the issues and hopefully minimize the future impact in churn.
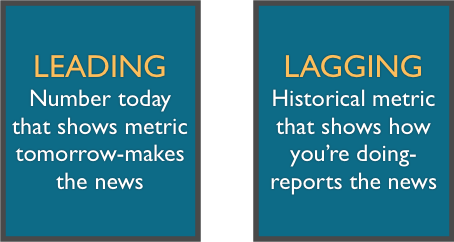
Ultimately, you need to decide whether the thing you're tracking helps you make better decisions sooner. Remember: a real metric has to be actionable. Lagging and leading metrics can both be actionable, but leading indicators show you what will happen, reducing your cycle time and making you leaner.
5. Correlated versus Causal metrics
A correlation is a seeming relationship between two metrics that change together, but are often changing as a result of something else. Take ice cream consumption and drowning. If you plotted these over a year, you'd see that they're correlated--they both go up and down at the same time. The more ice cream that's consumed, the more people drown. But no one would suggest that we reduce ice cream consumption as a way of preventing drowning deaths. That's because the numbers are correlated, and not causal. One isn't affecting the other. The factor that affects them both is actually the time of year--when it's summer, people eat more ice cream and they also drown more.

Finding a correlation between two metrics is a good thing. Correlations can help you predict what will happen. But finding the cause of something means you can change it. Usually, causations aren't simple one-to-one relationships--there’s lots of factors at play, but even a degree of causality is valuable.
You prove causality by finding a correlation, then running experiments where you control the other variables and measure the difference. It's hard to do, but causality is really an analytics superpower--it gives you the power to hack the future.
So what metrics are you tracking?
We’ve covered some fundamentals about analytics and picking good metrics. It's not the whole story (to learn more see our presentations and workshops on Lean Analytics), but I'd encourage you to take a look at what you're tracking and see if the numbers you care the most about meet the criteria defined in this post. Are the metrics ratios/rates? Are they actionable? Are you looking at leading or lagging metrics? Have you identified any correlations? Could you experiment your way to discovering causality?
And remember: analytics is about measuring progress towards goals. It's not about endless reports. It's not about numbers that go constantly "up and to the right" to impress the press, investors or anyone else. Good analytics is about speeding up and making better decisions, and developing key insights that become cornerstones of your startup.